Downloads
Click on the underlined links below to download the files. All data files with a “.rar” at the end need to be unzipped after downloading (using WinZIP, WinRAR, 7-Zip, or a similar program). Please regard Conditions of Use for all products and refer to our How To Cite page for citation information.
Mean Annual Map Images
Image files of mean annual maps for select variables have been created and are available for download as *.JPG files. Due to the high number of variables, temporal resolutions, and map extents possible, only mean annual map images for select variables at the statewide extent have been generated. For the full list of variables used in this project, please see the project Report and the table of mapped variables.
Color Maps:
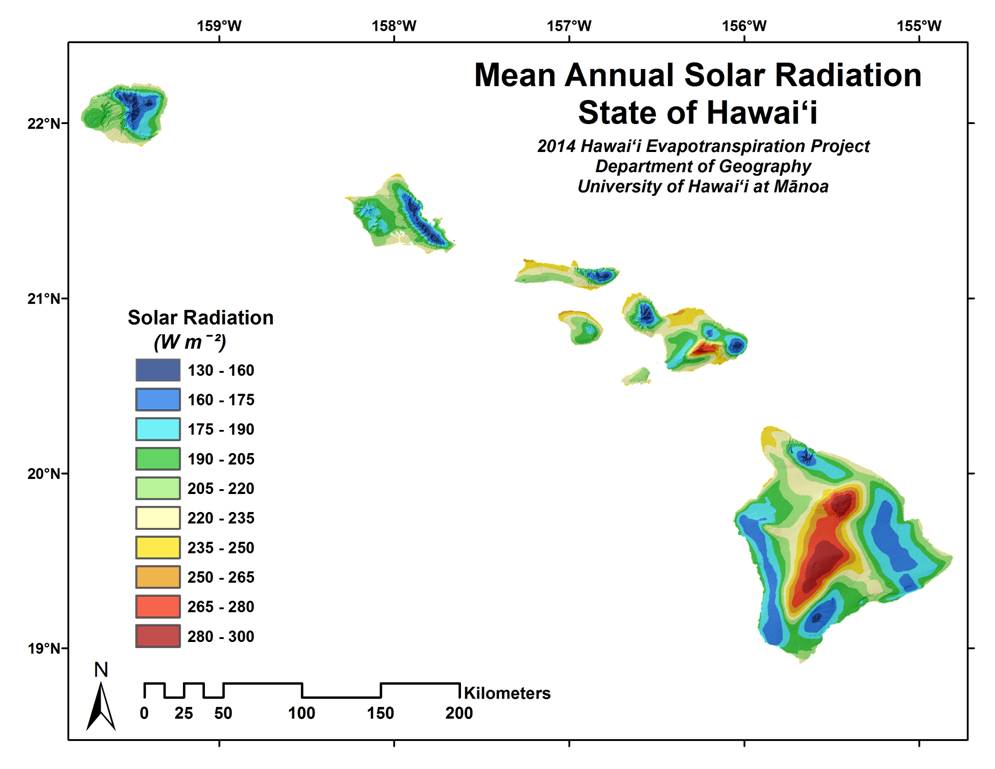
Unlike the interactive map which displays the variables on a continuous color ramp, these images display the values in categories. The categories were set based on the natural breaks in the values. The categories were set independently for different units, so the color breaks will differ slightly for different units.
Files for download:
*File will open in a new window. To save to your computer, right click and go to "Save image as..."
| Category | Variable | Mean Annual Map |
|---|---|---|
| Radiation | Solar Radiation (W/m²) | SolarRadiation_MeanAnn.jpg |
| Clear Sky Radiation (W/m²) | ClearSkyRadiation_MeanAnn.jpg | |
| Diffuse Radiation (W/m²) | DiffuseRadiation_MeanAnn.jpg | |
| Downward Longwave Radiation (W/m²) | DownwardLongwave_MeanAnn.jpg | |
| Upward Longwave Radiation (W/m²) | UpwardLongwave_MeanAnn.jpg | |
| Net Radiation (W/m²) | NetRadiation_MeanAnn.jpg | |
| Other Climate Variables |
Air Temperature (°C) | AirTemp_MeanAnn.jpg |
| Wind Speed (m/s) | WindSpeed_MeanAnn.jpg | |
| Relative Humidity (%) | RelativeHumidity_MeanAnn.jpg | |
| Vapor Pressure Deficit (Pa) | VPD_MeanAnn.jpg | |
| Albedo (%) | Albedo_MeanAnn.jpg | |
| Cloud Frequency | CloudFrequency_MeanAnn.jpg | |
| Available Soil Moisture | SoilMoisture_MeanAnn.jpg | |
| Fractional Canopy Wetness | FractionalCanopyWetness_MeanAnn.jpg | |
| Fractional Vegetation Cover | FractionalVegCover_MeanAnn.jpg | |
| Leaf Area Index | LAI_MeanAnn.jpg | |
| Land Cover | LandCoverMap.jpg | |
| Midday Air Layer Heat Storage | QA_Midday_MeanAnn.jpg | |
| Midnight Air Layer Heat Storage | QA_Midnight_MeanAnn.jpg | |
| Midday Biomass Heat Storage | QB_Midday_MeanAnn.jpg | |
| Midnight Biomass Heat Storage | QB_Midnight_MeanAnn.jpg | |
| Midday Soil Heat Flux (W/m²) | SoilHeatFlux_Midday_MeanAnn.jpg | |
| Midnight Soil Heat Flux (W/m²) | SoilHeatFlux_Midnight_MeanAnn.jpg | |
| Vegetation Height (m) | VegetationHeight_MeanAnn.jpg | |
| Evaporation | Actual Evapotranspiration (mm) | AET_mm_MeanAnn.jpg |
| Latent Energy Flux (W/m²) | LE_wm2_MeanAnn.jpg | |
| Grass Reference Surface Potential Evapotranspiration (mm) | GrassReference_PET_mm_MeanAnn.jpg | |
| Grass Reference Surface Potential Evapotranspiration (W/m²) | GrassReference_PET_wm2_MeanAnn.jpg | |
| Penman-Monteith Potential Evapotranspiration (mm) | PenmanMonteith_PET_mm_MeanAnn.jpg | |
| Penman-Monteith Potential Evapotranspiration (W/m²) | PenmanMonteith_PET_wm2_MeanAnn.jpg | |
| Priestley-Taylor Potential Evapotranspiration (mm) | PriestleyTaylorPET_mm_MeanAnn.jpg | |
| Priestley-Taylor Potential Evapotranspiration (W/m²) | PriestleyTaylorPET_wm2_MeanAnn.jpg | |
| Transpiration (mm) | Transpiration_mm_MeanAnn.jpg | |
| Soil Evaporation (mm) | SoilEvap_mm_MeanAnn.jpg | |
| Wet Canopy Evaporation (mm) | WetCanopyEvap_mm_MeanAnn.jpg |
For mean rainfall maps, please see the Rainfall Atlas page
GIS Layers - ESRI Raster Format
Gridded GIS layers of select variables have been made available for download. Users can download the grids in ESRI and ASCII grid formats. These are available in various units, and each compressed *.rar file contains all maps for the given time scale (see below). Layers are available for the entire state (except Ni‘ihau). All files use geographic coordinates, WGS84 datum.
For more information about GIS, how to use GIS layers, or to obtain more Hawai‘i layers, please refer to the Hawai‘i State GIS page, http://planning.hawaii.gov/gis/. After downloading, users can upload layers to ArcGIS Online to make their own maps as an alternative to using a desktop GIS program, http://www.arcgis.com/home/.
ESRI Grid Files:
Raster files are available at 250 m resolution (0.00225 x 0.00225 cell size) for the state. These are available in multiple units (depending on the variable), and multiple time scales: monthly (Jan-Dec, Annual - 13 maps), monthly-hourly (12 x 24 maps), and annual-hourly (24 maps). All can be downloaded in ESRI grid format or ASCII grid format.
| Category | Variable | Monthly | Monthly-Hourly | Annual-Hourly |
|---|---|---|---|---|
| Radiation | Solar Radiation | |||
| Clear Sky Radiation | ||||
| Diffuse Radiation | ||||
| Downward Longwave Radiation |
||||
| Upward Longwave Radiation |
||||
| Net Radiation | ||||
| Other Climate Variables |
Air Temperature | |||
| Surface Temperature | ||||
| Wind Speed |
N/A |
N/A |
||
| Relative Humidity | ||||
| Vapor Pressure Deficit | ||||
| Albedo |
N/A |
N/A |
||
| Cloud Frequency | ||||
| Available Soil Moisture |
N/A |
N/A |
||
| Canopy Wetness Fraction | ||||
| Vegetation Cover Fraction |
N/A |
N/A |
||
| Leaf Area Index |
N/A |
N/A |
||
| Land Cover |
N/A |
N/A |
||
| Air Layer Heat Storage | ||||
| Biomass Heat Storage | ||||
| Soil Heat Flux | ||||
| Vegetation Height |
N/A |
N/A |
||
| Normalized Difference Vegetation Index (NDVI) |
N/A |
N/A |
||
| Enhanced Vegetation Index (EVI) |
Index | N/A | N/A | |
| Canopy Conductance | * | * | * | |
| Roughness Length |
N/A |
N/A |
||
| Terrain Shading | N/A | * | N/A | |
| Clear Sky Radiation with Terrain Shading |
||||
| Air Density | kg/m3 | kg/m3 | kg/m3 | |
| Available Energy | W/m² | W/m² | W/m² | |
| Evaporation | Actual Evapotranspiration | |||
| Latent Heat Flux | ||||
| Grass Reference Surface Potential Evapotranspiration |
||||
| Penman-Monteith Potential Evapotranspiration |
||||
| Priestley-Taylor Potential Evapotranspiration |
||||
| Transpiration | ||||
| Soil Evaporation | ||||
| Wet Canopy Evaporation |
For mean rainfall maps, please see the Rainfall Atlas page
GIS Layers - ASCII Grid Format
Gridded GIS layers of select variables have been made available for download. Users can download the grids in ESRI and ASCII grid formats. These are available in various units, and each compressed *.rar file contains all maps for the given time scale (see below). Layers are available for the entire state (except Ni‘ihau). All files use geographic coordinates, WGS84 datum.
ASCII Grid Files:
ASCII files are available at 250 m resolution (0.00225 x 0.00225 cell size) for the state. These are available in multiple units (depending on the variable), and multiple time scales: monthly (Jan-Dec, Annual - 13 maps), monthly-hourly (12 x 24 maps), and annual-hourly (24 maps). For ESRI raster grid format, see the above drop down menu.
| Category | Variable | Monthly | Monthly-Hourly | Annual-Hourly |
|---|---|---|---|---|
| Radiation | Solar Radiation | |||
| Clear Sky Radiation | ||||
| Diffuse Radiation | ||||
| Downward Longwave Radiation |
||||
| Upward Longwave Radiation |
||||
| Net Radiation | ||||
| Other Climate Variables |
Air Temperature | |||
| Surface Temperature | ||||
| Wind Speed |
N/A |
N/A |
||
| Relative Humidity | ||||
| Vapor Pressure Deficit | ||||
| Albedo |
N/A |
N/A |
||
| Cloud Frequency | ||||
| Available Soil Moisture |
N/A |
N/A |
||
| Canopy Wetness Fraction | ||||
| Vegetation Cover Fraction |
N/A |
N/A |
||
| Leaf Area Index |
N/A |
N/A |
||
| Land Cover |
N/A |
N/A |
||
| Air Layer Heat Storage | ||||
| Biomass Heat Storage | ||||
| Soil Heat Flux | ||||
| Vegetation Height |
N/A |
N/A |
||
| Normalized Difference Vegetation Index (NDVI) |
N/A |
N/A |
||
| Enhanced Vegetation Index (EVI) |
Index | N/A | N/A | |
| Canopy Conductance | ||||
| Roughness Length | m | N/A | N/A | |
| Terrain Shading |
N/A |
N/A |
||
| Clear Sky Radiation with Terrain Shading |
||||
| Air Density | kg/m3 | kg/m3 | kg/m3 | |
| Available Energy | W/m² | W/m² | W/m² | |
| Evaporation | Actual Evapotranspiration | |||
| Latent Heat Flux | ||||
| Grass Reference Surface Potential Evapotranspiration |
||||
| Penman-Monteith Potential Evapotranspiration |
||||
| Priestley-Taylor Potential Evapotranspiration |
||||
| Transpiration | ||||
| Soil Evaporation | ||||
| Wet Canopy Evaporation |
For mean rainfall maps, please see the Rainfall Atlas page
Report
Conditions of Use
All maps, data, graphs, and narrative material available on this web site are subject to the following conditions.
Images. All color map images presented here are available for reproduction and distribution. The map source must be included in any reproduction.
Gridded Map Data. All gridded data and all other data presented here are available for reproduction and distribution for non-commercial use. The data source must be prominently stated whenever presenting these data in any form or any product derived in whole or part from these data.
Crediting the Source. Any reproduction or use of the images, maps, graphs, data, other information, or any product derived in whole or part from these data must credit the source in the following manner:
Please keep in touch about the best way to cite - we will update the citation once the journal article has been published:
Giambelluca, T.W., X. Shuai, M.L. Barnes, R.J. Alliss, R.J. Longman, T. Miura, Q. Chen, A.G. Frazier, R.G. Mudd, L. Cuo, and A.D. Businger. 2014. Evapotranspiration of Hawai‘i. Final report submitted to the U.S. Army Corps of Engineers—Honolulu District, and the Commission on Water Resource Management, State of Hawai‘i.
Sponsors of the 2014 Solar Radiation of Hawaiʻi project. The 2014 Solar Radiation of Hawai‘i project was developed under an agreement between the State of Hawaiʻi Commission on Water Resource Management and the U.S. Army Corps of Engineers, Honolulu District under Section 22 of the Water Resources Development Act of 1974.
No Warranty. We have made every effort to make all images, maps, graphs, data, and other information provided on this web site accurate and error-free. However, we do not guarantee the accuracy of any images, maps, graphs, data, or other information. All content is provided without warranty of any kind.

